Blog
Latest News From Lakeland Hometown Properties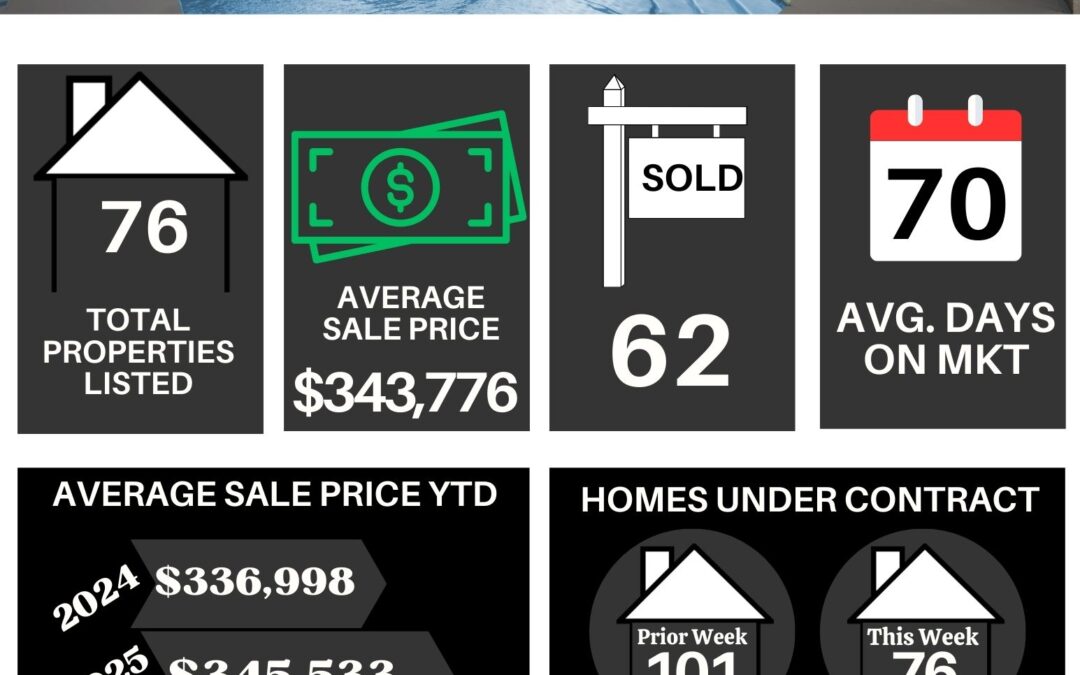
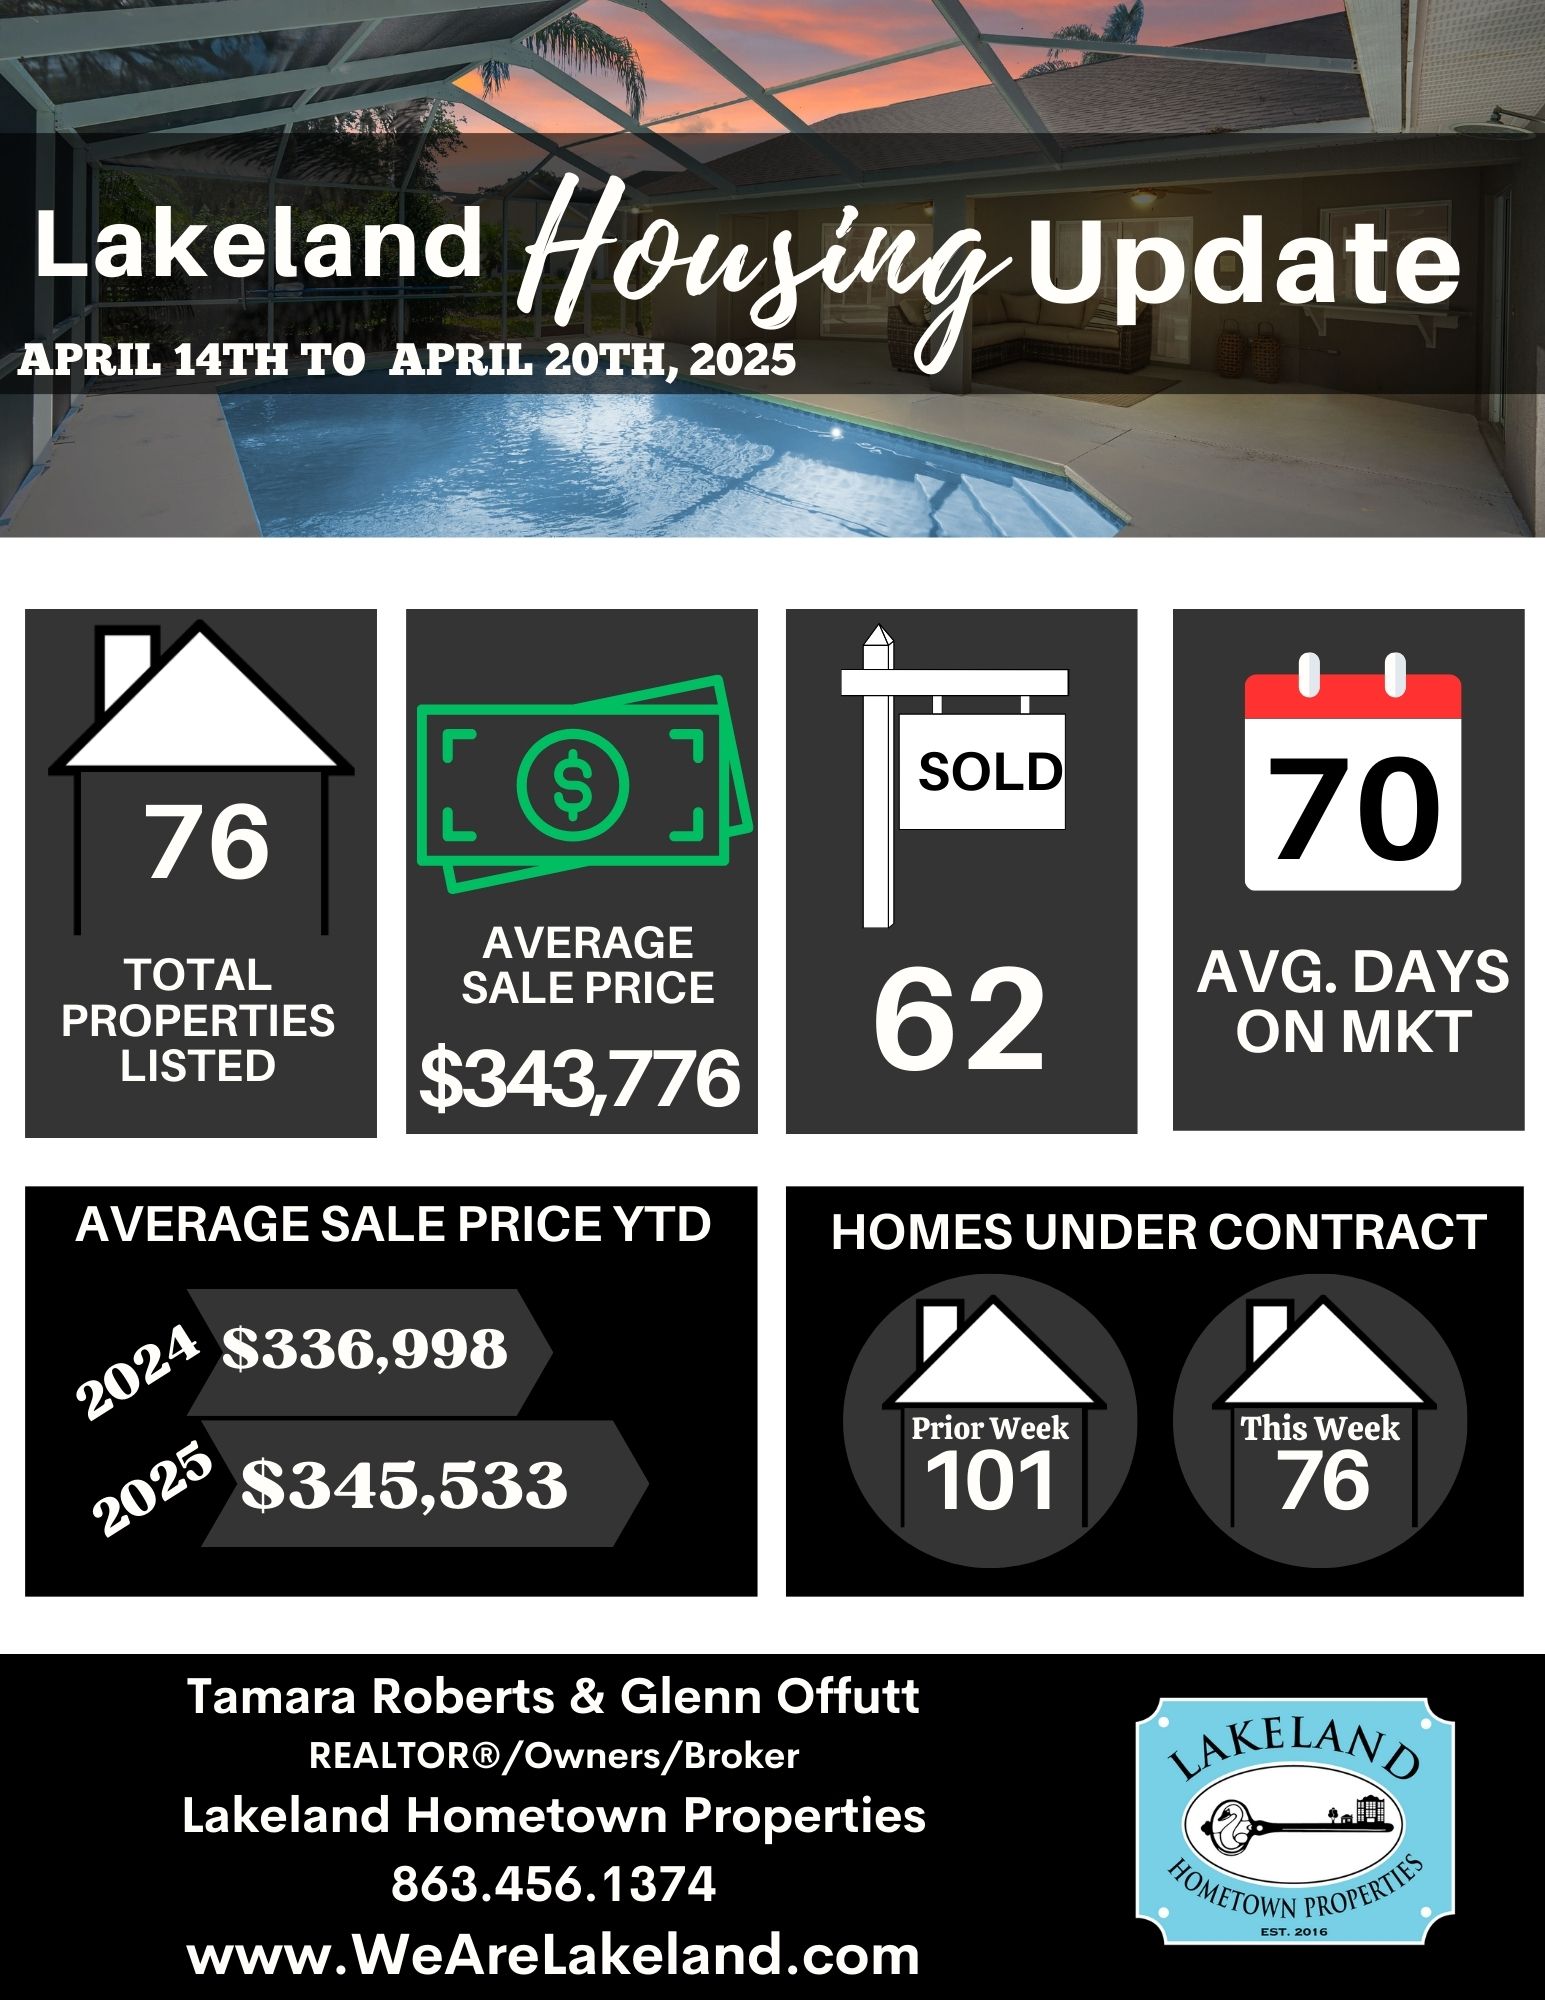
Your Lakeland Weekly Market Stats for April 14th to April 20th, 2025
Here are your weekly stats for activity in Lakeland! 📊✨
🏡 Homes currently for sale in Lakeland:
➡️ 1,105– Last week we had 1,103 homes for sale. Inventory is staying steady currently. We will see if it stays that way or if demand will bring that down. 🏊♀️ 144 of those homes have their own private pool, or 13% of active homes for sale.
🔨 116 Active homes are new construction 🏗️, making up 10% of the inventory. The new home construction in Lakeland is not nearly as high as in the rest of the county and is stable in that range. 🌟 205 homes were built in 2020 or newer, which is 19%.
📈 Polk County’s new construction is in high demand!
🏠 1,313 of the 6,623 active homes (20%) are new builds, and 2,347(35%) were built in 2020 or newer.
📋 Weekly Highlights:
📌 76 New Listings — Down from 102 last week!
📝 76 New Contracts — Down from 101 last week.
✅ 62 Sold/Closed Homes — Down from 86 last week.
💵 Market Numbers:
$343,776 Average Sold Price 💰
$353,586 Average List Price ($381,048 Avg. Active List Price) 🏷️
$189.56 Average Price Per Square Foot 📏
70 Average Days on Market Before Contract ⏳
97% List-to-Sales Price 🔥
🏠 Average sized home for the Sold properties:
🛏️ 3 Bedrooms
🛁 2 Bathrooms
📐 1,805 Heated Square Feet
✨ Largest Sale for the Week:
🛏️ 5 Bedrooms
🛁 4 Bathrooms
📐 4,578 Heated Square Feet
💰 $965,000 Sales Price
🏷️ $985,000 List Price
🔢 98% List-to-Sale Percentage
⏳ 160 Days on Market
📏 $210.79 Price Per Square Foot
📍 Located in 33813 in Highlands-In-The-Woods
💵 Buyer used Conventional Financing to purchase the home.
🏡 Smallest Sale for the Week:
🛏️ 1 Bedrooms
🛁 1/1 Bathroom
📐 928 Heated Square Feet
💰 $50,000 Sales Price
🏷️ $84,900 List Price
🔢 59% List-to-Sale Percentage
⏳ 57 Days on Market
📏 $53.88 Price Per Square Foot
💵 Buyer used Cash to purchase the home.
📍 Located in 33805, in Lakeside Village 🏘️
🙏 Thanks for taking the time to check out these stats!
If you’d like to chat about trends, how the market compares to previous years, or explore how we can help you, let’s connect! 💬
📞 Reach out today to set up a time to get together! 🏡 Real estate is our passion!
#wearelakeland #lakelandhometownproperties #lakelandrealestate #communitymatters #bettertogether #movetolakeland #movetoflorida #lakelandmarketstats #smallbusinessbigdreams #smallbusinessbigheart #iwanttobeyourrealtor 🏡✨
Your Lakeland Weekly Market Stats for May 20th to May 26th, 2024
Here are your weekly stats for activity in Lakeland! Homes currently for sale in Lakeland: 808--Last week we had 803 homes for sale. Inventory is staying pretty stable in that range. We will see if it stays with that trend or if we will get more listings. 111 of those...
Your Lakeland Weekly Market Stats for May 13th to May 19th, 2024
Here are your weekly stats for activity in Lakeland! Homes currently for sale in Lakeland: 803--Last week we had 805 homes for sale. Inventory is staying pretty stable in that range. We will see if it stays with that trend or if we will get more listings. 112 of those...

Your Lakeland Weekly Market Stats for May 06th to May 12th, 2024
Here are your weekly stats for activity in Lakeland! Homes currently for sale in Lakeland: 805--Last week we had 790 homes for sale. Inventory is staying pretty stable in that range. We will see if it stays with that trend or if we will get more listings. 121 of those...

April Market Stats for Lakeland

Under Contract in Lake James!
And we are under contract on this beautiful home in the gated Lake James Subdivision! Tamara and I are so excited for our buyers who are like family to us. They deserve to slow things down and enjoy the maintenance free lifestyle that comes along with living in this...
Your Lakeland Weekly Market Stats for April 29th to May 05th, 2024
Here are your weekly stats for activity in Lakeland! Homes currently for sale in Lakeland: 790--Last week we had 782 homes for sale. Inventory is staying pretty stable in that range. We will see if it stays with that trend or if we will get more listings. 126 of those...